
Get all the latest news on coronavirus and more delivered daily to your inbox. Sign up here.
In the wake of the coronavirus outbreak, new data shows how the behavior of Americans has shifted dramatically in some states.
Unacast, a company that tracks where people go and why — so-called “social mobility,” has created a Social Distancing Scoreboard based on tens of millions of anonymous mobile phones. It uses that data to build the maps that show changes in the “average distance traveled” by Americans as they respond to calls for social distancing.
Social distancing — avoiding mass gatherings and maintaining approximately 6 feet from others — is considered one of the most effective ways to prevent the spread of the virus.
3D-PRINTING TECHNOLOGY BATTLES CORONAVIRUS OUTBREAK
The scoreboard, updated daily, is a way to “measure and understand the efficacy of social distancing initiatives at the local level,” according to the company. The goal is to show how people adapt their everyday behavior in the wake of the virus outbreak.
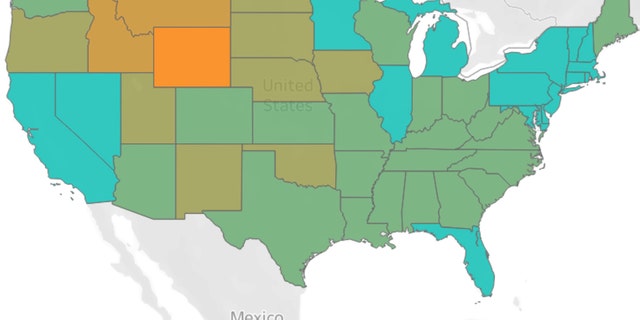
Change in distance traveled in the U.S. compared to pre-outbreak travel. The blueish states show the largest decrease in travel distance. (Credit: Unacast/Mapbox/OpenStreetMap)
For example, switching to your home office or not going to entertainment venues reduces the daily travel distance and boosts social distancing, according to Unacast. Also, canceling travel and vacations contributes to a decrease in travel distance.
State by state
Broken down by states and counties, the scores range from “A” for the most change to “F” for the least amount of change compared to pre-outbreak travel distance. Areas that see at least a 40 percent decrease in average distance traveled get an A, while those that exhibit less than a 10 percent decrease or increase are assigned an F, according to Unacast.
DYSON BUILDS VENTILATORS FOR CORONAVIRUS PATIENTS
As of Thursday, most of the states with the biggest changes in average distance traveled (those that receive the highest grade) are the most populous ones such as New York, New Jersey, Pennsylvania, Texas and California, according to the interactive map.
The states with the lowest grades tend to be less-populated states such as Wyoming (which received an F), Montana (graded a D) and New Mexico (garnering a C grade).
The counties and localities with the top ratings include San Juan County, Colo; Kalawo County, Hawaii, and three areas in Alaska including Haines Borough and Skagway Municipality.
The counties and localities with the lowest ratings include Wheeler County, Texas; Blaine County, Mont., and Baca County, Colo.
Google Maps does it, too
Though unrelated to the Unacast map, Google Maps can also help with social distancing. Maps can show you popular times for places like supermarkets and drug stores.
“Google may show information including popular times, live visit information, wait times and typical visit duration,” according to the search giant.
CLICK HERE TO GET THE FOX NEWS APP
The popular times graph, for example, shows how busy a location typically is during different times of the day. And live visit data show how active a location is at the moment.